AutoChart
AutoChart is an AutoCAD, BricsCAD and ArcView extension that automates the production of North-Up
and alignment sheets for both Hydrographic and Terrestrial data sets.
AutoChart helps achieve compressed delivery schedules by creating fully
georeferenced multi-paneled charts in a fraction of the time taken using
manual drafting techniques.
New Product - AutoChart for ArcGIS Pro
Watch AutoChart for ArcGIS in action importing GIS data and creating Geodetic Cable Alignment Charts
Watch AutoChart for ArcGIS in action importing GIS data and creating Pipeline Inspection Alignment Charts
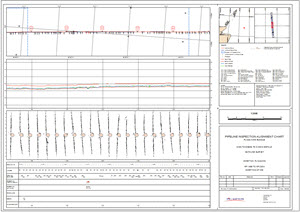
Chart Types
- Site Surveys
- Cable Route Surveys
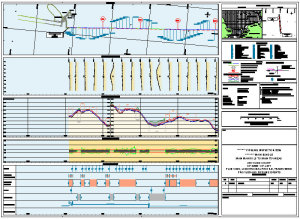
- Pipeline Route Surveys (Prelay through to Inspection)
- Pipeline Route Engineering (Onshore & Offshore)
- EEZ Surveys
- Wind Farms
Chart Examples
Wind Farm Chart Example
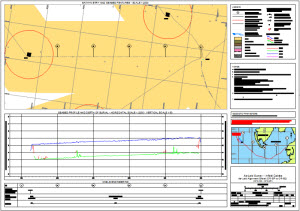
 Watch AutoChart in action creating Wind Farm Charts
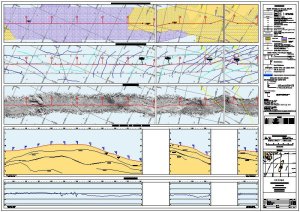
Pipeline Inspection Chart Example
Take a tour of a Pipeline Inspection Chart
Watch AutoChart in action creating Pipeline Inspection Charts
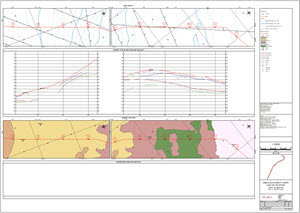
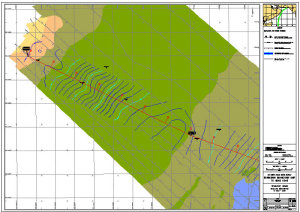
Cable Route Chart Example
Take a tour of a Cable Route Chart
Watch AutoChart in action creating Cable Route Charts
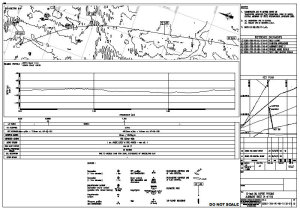
North Up Chart Example
Take a tour of a North Up Chart
Watch AutoChart in action creating North Up Charts
Pipeline Engineering Example
Watch AutoChart in action creating Pipeline Engineering Charts
Latest News
Product Updates
New Product
AutoChart for BricsCAD
released for BricsCAD 25
AutoChart for AutoCAD update released for Autodesk 2026 Suite
AutoChart and HydroGIS update released for Esri ArcGIS Pro 3.5
VisualGIS Server
Digital Video in the Browser - Now with 3D View!
Shell VisualGIS Server
Shell Norway has implemented VisualGIS Server in Azure Cloud allowing internal and external users access to Digital Video over the internet
more news...
Wish Software Blogs
Product Support Blog
Partners