|
|

|
FR696 - Create Pipesheets |

|

|

|

|

|
||
|
FR696 - Create Pipesheets |
|
|
|
|

|

|
FR696 - Create Pipesheets
|
|
|
FR696 - Create Pipesheets |
|
|
|
|
|
||
|
FR696 - Create Pipesheets |
|
|
|
|
|
|
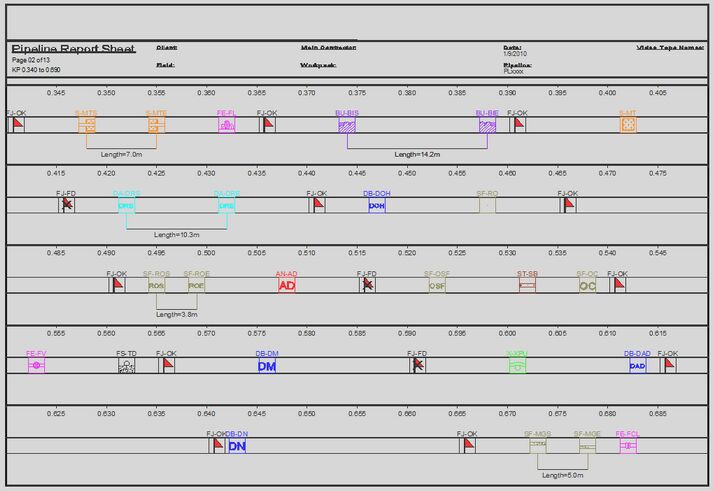
A new command has been added that will automatically create a set of Pipesheet events charts along a specified Kp range. The command uses a Base template drawing to provide the chart background and allows up to six events panels on each chart. The format of the data within these events panels is controlled by an Event Box ini file in the normal Create Events manner, with the data being read from an events ASCII file.
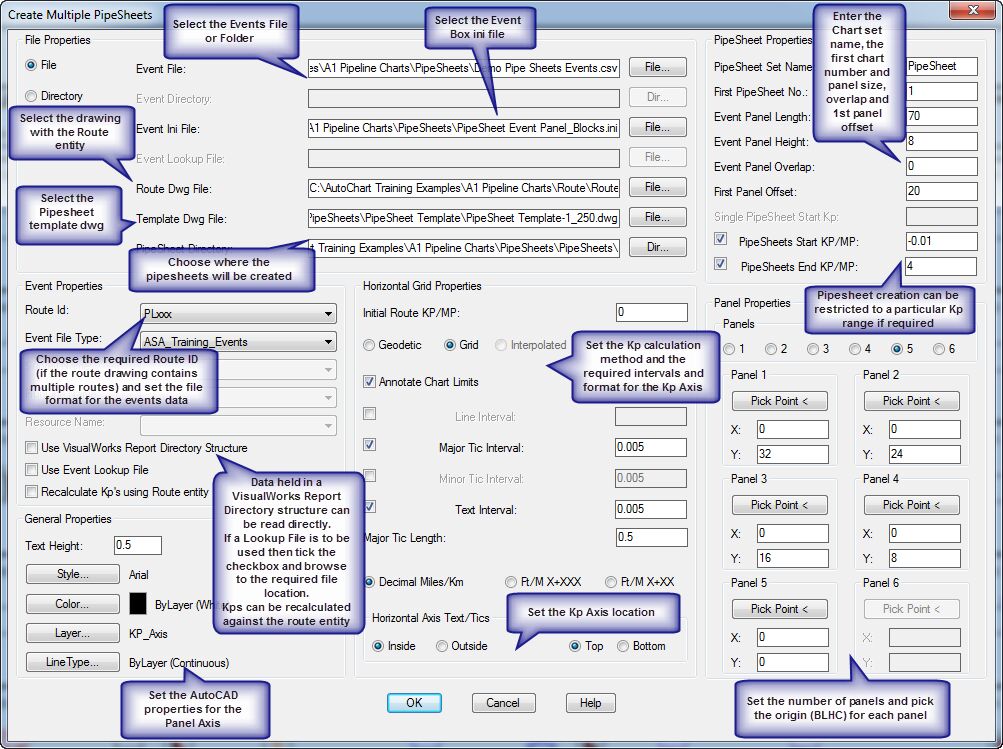
The Events data for the pipesheet can be read from any ASCII file source. The event format would normally be set up in a Custom Format Events ini file although the usual built in AutoChart formats can also be used. Data can be read from a single file, a directory of files or from VisualWorks Events.csv files in a VisualWorks Report Directory structure.
The Event Ini file is created in the same manner as for the normal Create Events Panel command, with Line and Point events for all of the primary/secondary event codes that are required to be shown on the Pipesheet. See 'The Event Box ini File' section of the AutoChart Help File for more details. If required, an Events Lookup file can be specified that will translate the Primary/Secondary codes within the data file to a separate chart code where the event is labeled with the .lookup variable.
The drawing file containing the required Route entity should be selected and the appropriate Route ID chosen if this drawing contains multiple routes. This enables event KPs to be recalculated against the Route entity if required and also allows the Chart Kp limits to be annotated.
The Template drawing should be drawn in the same manner as the normal AutoChart Create Charts Template (i.e. in 'real-world' units at the appropriate scale). The template can contain the usual AutoChart codes for Kp limits, chart number, etc. and these will be automatically calculated and filled in when the Charts are created. There is no option to specify a separate Base Drawing. Instead this should already be xreffed (by the User) into the Template drawing before running the Create Pipesheets command. The Base Xref should contain all of the entities that will remain the same for every chart in the series (i.e. the Chart frames/Titles/Legend etc.) whereas the Template drawing itself should contain the entities that will alter from chart to chart (i.e. the Chart number/reference, the Kp Limits, etc.). The Chart Directory is set to the required folder location for the pipesheet drawing files to be created.
Panels are automatically created along the entire route or optionally over a specified Kp range. The Panel Length and Height should be entered in drawing units and the required overlap between panels can also be set (or enter 0 to have no panel overlap). A First Panel offset can be entered to allow an initial overlap within the first pipesheet panel.
The Kp Axis should be set up with the Line/Major Tic/Minor Tic/Text intervals as required along with the Kp calculation method. If the Pipesheet template contains the codes SSS.SSS and EEE.EEE then the Kp limits for each chart can automatically be calculated and filled in and the required format of the Kp annotation can be selected.
The required number of Events panels within each chart should be selected (up to six panels can be added) and the Bottom Left Hand Corner coordinates for each of these panels should be picked.
When run, the command will automatically create all of the pipesheets for the length of the Route (or for the specified Start and/or End Kp/MP values) and add the Events data to each panel.