|
|

|
FR695 - Create Events |

|

|

|

|

|
||
|
FR695 - Create Events |
|
|
|
|

|

|
FR695 - Create Events
|
|
|
FR695 - Create Events |
|
|
|
|
|
||
|
FR695 - Create Events |
|
|
|
|
|
|
The Create Events command has been modified so that now Block Symbols can be defined within the Event Box ini file and when the Create Events command is run, the symbols will be inserted for the appropriate Events Codes.
The option to use block symbols within the Events panels is set up within the Event Box ini file itself, there are no options within the Create Events dialog.
The Blocks are defined in two parts - a Blocks section containing Block Codes which hold the path to the block drawing file and the required Block Scale. The Event definition records then add the required Block Code for the particular Primary/Secondary event code as well as the Block insert Percentage:
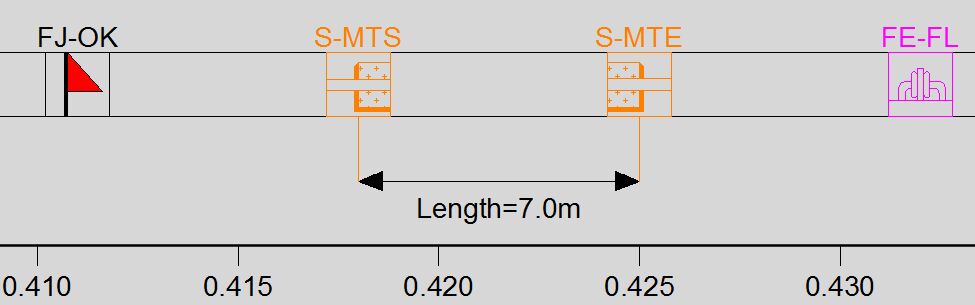
A Block Code of ARROW (note this is Case Sensitive and must be all in Capitals) can be defined in the Blocks Section and then this used to place automatically oriented arrow heads on the ends of Line Events by using the 'Y' option at the end of the the Line Event definition. If Arrows are not required then the option should be set to 'N'. Note that the Arrow Head Symbol drawing should be created with the point of the arrow at 0,0 and pointing left - AutoChart will automatically flip the arrow when it is placed at the right side of the line event.
TEXTSTYLES
#Name,Font,Height,Width
WMF-ARIAL1,arial.ttf,0,1
LINETYPES
#Name,File
LAYERS
#LayerName,Linetype,Colour
ANODE,Continuous,Red
F J,Continuous,White
STRIPCOUNT
#StripCount
1
STRIPWIDTH
#StripNumber(must be in order for the moment),StripWidth
EVENTFORMAT
#EventFormat
ASA_Training_Events
BLOCKS
#BlockFormat
#Block Code,Block Path,Block Scale
AN-AD,C:\AutoChart Training Examples\A1 Pipeline Charts\PipeSheets\Pipesheet Symbols\Anode Damaged.dwg,250
AN-AF,C:\AutoChart Training Examples\A1 Pipeline Charts\PipeSheets\Pipesheet Symbols\Anode Retrofit.dwg,250
AN-AR,C:\AutoChart Training Examples\A1 Pipeline Charts\PipeSheets\Pipesheet Symbols\Anode Remote.dwg,250
FJ-OK,C:\AutoChart Training Examples\A1 Pipeline Charts\PipeSheets\Pipesheet Symbols\Field Joint.dwg,250
ARROW,C:\AutoChart Training Examples\A1 Pipeline Charts\PipeSheets\Pipesheet Symbols\Left Arrow.dwg,250
.
.
.
CODES
#Point,Strip,PrimaryCode,SecondaryCode,Layer,Color,Linetype,LineWidth,StartTic%,EndTic%,TextStyle,TextHeight,TextValue1,TextOrientation1,TextPosition%1,TextJustification1,TextValue2,TextOrientation2,TextPosition%2,TextJustification2,FilterEventDataField,FilterEventOperator,FilterEventValue,FilterTextDataField,FilterTextOperator,FilterTextValue,BlockCode,BlockPosition%
#Line/Video,Strip,PrimaryCodeStart,SecondaryCodeStart,PrimaryCodeEnd,SecondaryCodeEnd,Layer,Color,Linetype,LineWidth,LinePosition%,TextStyle,TextHeight,TextValue1,TextOrientation1,TextPosition%1,TextJustification1,TextValue2,TextOrientation2,TextPosition%2,TextJustification2,FilterEventDataField,FilterEventOperator,FilterEventValue,FilterTextDataField,FilterTextOperator,FilterTextValue
Line,1,S-MTS,,S-MTE,,0,256,ByLayer,0,80,WMF-ARIAL1,0.5,"Length="+.Length(0.1)+"m",Horizontal,83,Top Centre,,,,,,,,,,,Y
Line,1,S-VID,,S-VID,,0,256,ByLayer,0,80,WMF-ARIAL1,0.5,.Comment,Horizontal,83,Top Centre,,,,,,,,,,,N
Point,1,AN-DAMAGED,,ANODE,256,ByLayer,0,50,50,WMF-ARIAL1,0.5,.Primary,Horizontal,35,Middle Centre,,,,,,,,,,,AN-AD,50
Point,1,AN-RETROFIT,,ANODE,256,ByLayer,0,50,50,WMF-ARIAL1,0.5,.Primary,Horizontal,35,Middle Centre,,,,,,,,,,,AN-AF,50
Point,1,AN-REMOTE,,ANODE,256,ByLayer,0,50,50,WMF-ARIAL1,0.5,.Primary,Horizontal,35,Middle Centre,,,,,,,,,,,AN-AR,50
Point,1,FJ-OK,,F J,256,ByLayer,0,50,50,WMF-ARIAL1,0.5,.Primary,Horizontal,35,Middle Centre,,,,,,,,,,,FJ-OK,50
.
.
.
Note that if the Start Tic Percentage is set the same value as the End Tic Percentage, the Line for the point events will not be drawn - i.e. in the example above, only the Block symbol will be inserted with the required event annotation. Any annotation should be entered as event text rather than attributes within the block definition.